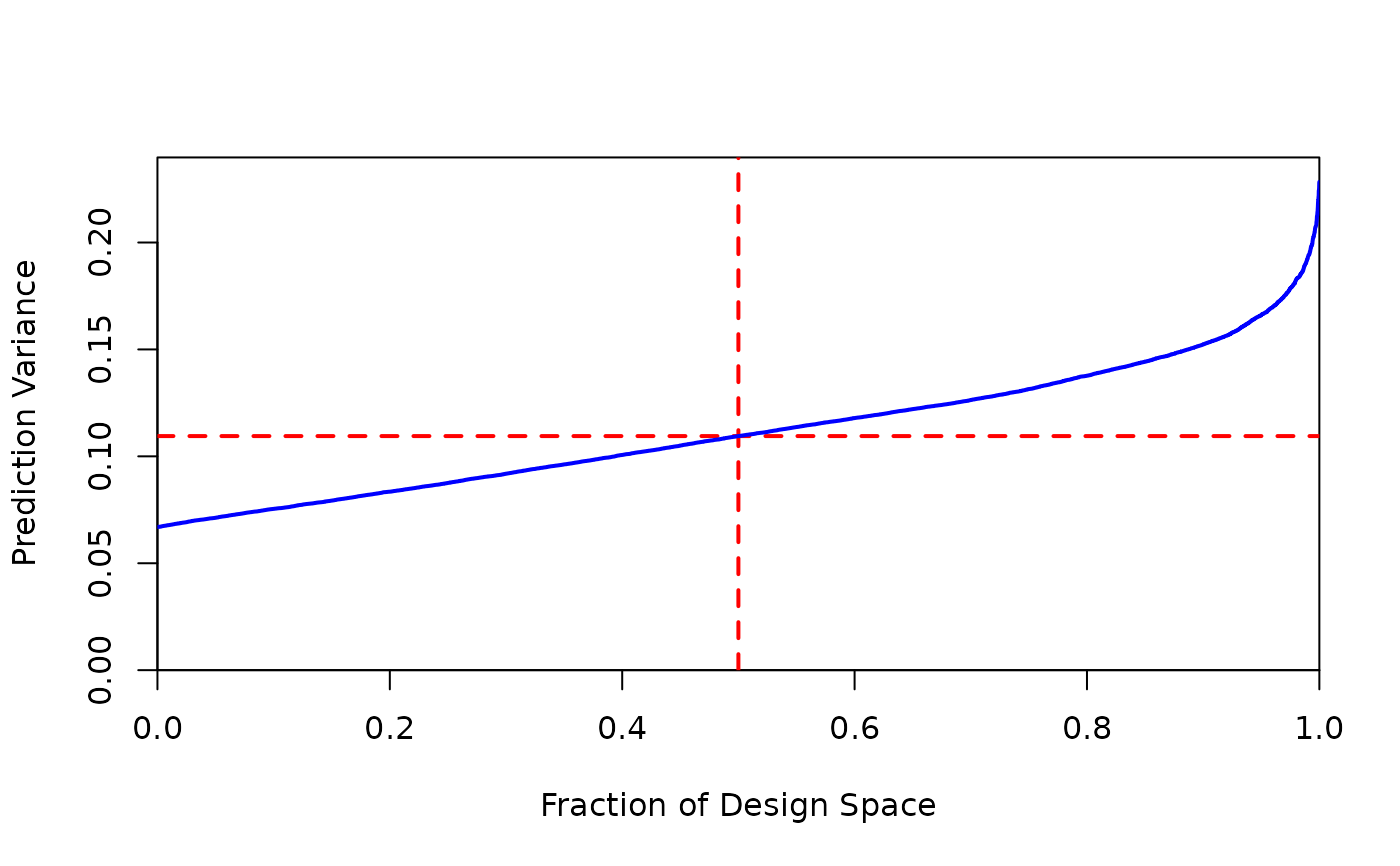
Creates a fraction of design space plot
Usage
plot_fds(
  skpr_output,
  model = NULL,
  continuouslength = 1001,
  plot = TRUE,
  sample_size = 10000,
  yaxis_max = NULL,
  moment_sample_density = 10,
  description = "Fraction of Design Space",
  candidate_set = NA,
  high_resolution_candidate_set = NA
)
Arguments
- skpr_output
The design, or the output of the power evaluation functions. This can also be a list of several designs, which will result in all of them being plotted in a row (for easy comparison).
- model
Default
NULL. The model, ifNULLit defaults to the model used ineval_design()orgen_design().- continuouslength
Default
11. The precision of the continuous variables. Decrease for faster (but less precise) plotting.- plot
Default
TRUE. Whether to plot the FDS, or just calculate the cumulative distribution function.- sample_size
Default
10000. Number of samples to take of the design space.- yaxis_max
Default
NULL. Manually set the maximum value of the prediction variance.- moment_sample_density
Default
10. The density of points to sample when calculating the moment matrix to compute I-optimality if there are disallowed combinations. Otherwise, the closed-form moment matrix can be calculated.- description
Default
Fraction of Design Space. The description to add to the plot. If a vector and multiple designs passed to skpr_output, it will be the description for each plot.- candidate_set
Default
NA. If the original design did not come from skpr and has disallowed combinations, the average prediction variance over the design region needs the original candidate set to accurately compute the I-optimality value. Note that this will estimate the valid design region using the convex hull of the given points, which is slow computationally for large designs: pass ahigh_resolution_candidate_setfor faster plotting.- high_resolution_candidate_set
Default
NA. If you have continuous numeric terms and disallowed combinations, the closed-form I-optimality value cannot be calculated and must be approximated by numeric integration. This requires sampling the allowed space densely, but most candidate sets will provide a sparse sampling of allowable points. To work around this, skpr will generate a convex hull of the numeric terms for each unique combination of categorical factors to generate a dense sampling of the space and cache that value internally, but this is a slow calculation and does not support non-convex candidate sets. To speed up moment matrix calculation, pass a higher resolution version of your candidate set here with the disallowed combinations already applied.
Value
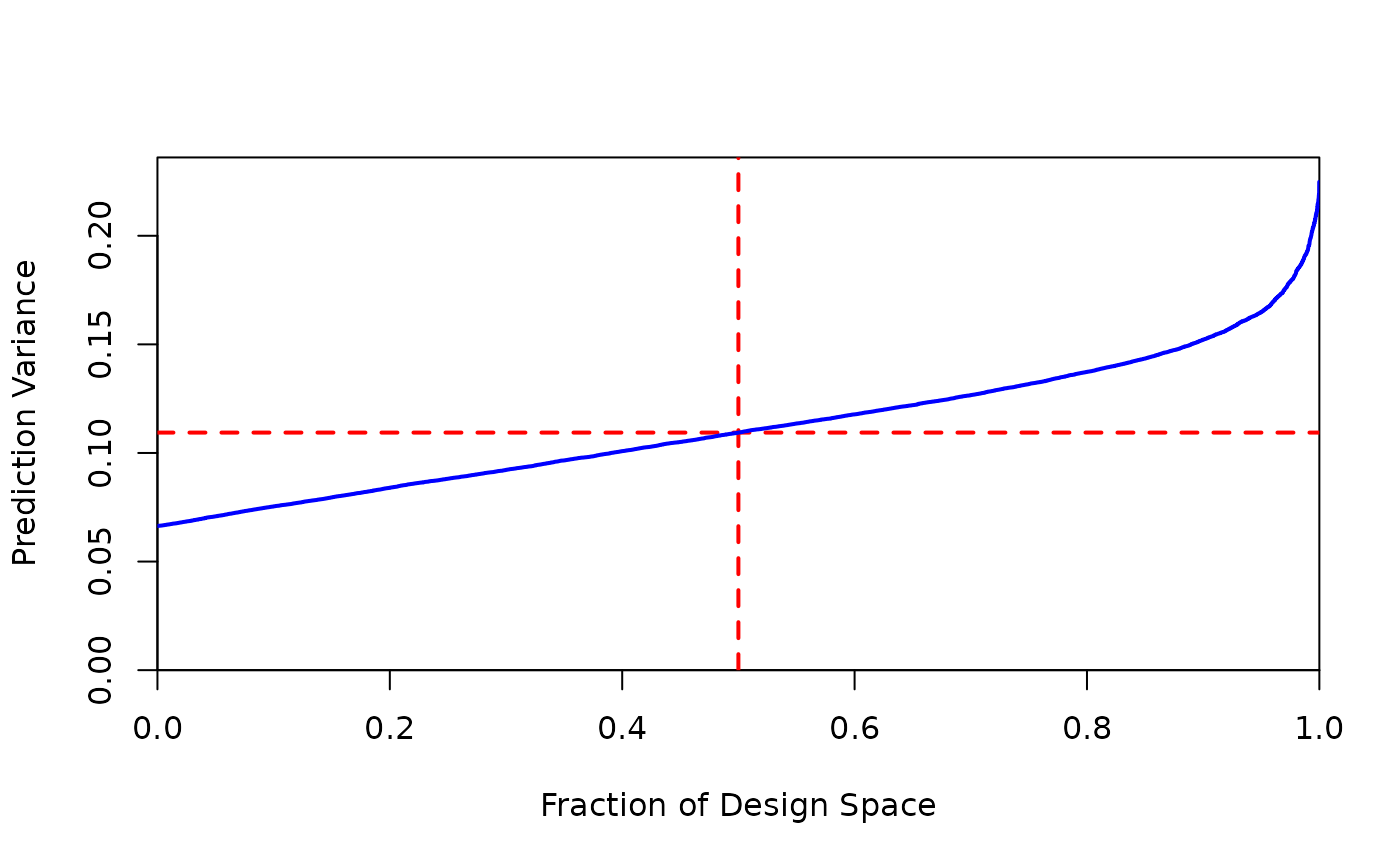
Plots design diagnostics, and invisibly returns the vector of values representing the fraction of design space plot. If multiple designs are passed, this will return a list of all FDS vectors.
Examples
#We can pass either the output of gen_design or eval_design to plot_correlations
#in order to obtain the correlation map. Passing the output of eval_design is useful
#if you want to plot the correlation map from an externally generated design.

#First generate the design:

candidate_set = expand.grid(X1 = c(1, -1), X2 = c(1, -1))

design = gen_design(candidate_set, ~(X1 + X2), 15)

plot_fds(design)


#We can also feed evaluation output
power = eval_design(design)
plot_fds(power)
#We can also feed evaluation output
power = eval_design(design)
plot_fds(power)